Case Study
THE BEST ASSET FOR SOFTWARE DEVELOPERS:
Reporting With List & Label in Cartegraph’s Asset Management Software
Hundreds of U.S. local governments, utilities, universities, and commercial campuses use Cartegraph software to manage their infrastructure assets, track maintenance work, optimize facility space, and make data-driven decisions. A key Cartegraph component that helps users drive smarter decision-making is the List & Label reporting tool. The report generator provides sophisticated reporting functions that have helped the Cartegraph team overcome a number of challenges.
Size of company: 130 employees
Headquarter: 3600 Digital Drive, Dubuque, IA 52003
www.cartegraph.com
Why A Reporting Tool is needed
Challenges
- Visualize complex operational data through reports with tables and charts.
- Deliver a web-based reporting application that runs browser independent.
- Provide fast processing and visualization of large and complex data structures.


WHY LIST & LABEL IS THE BEST SOLUTION
Benefits
- Less development time for implementing complex reports with WYSIWYG Ad-hoc Designer and Web Designer.
- Support for all leading browsers on any device through web controls.
- Ultra-fast designer start-up even with large databases enabled by delay loaded-data.
Work with list & label
Solution
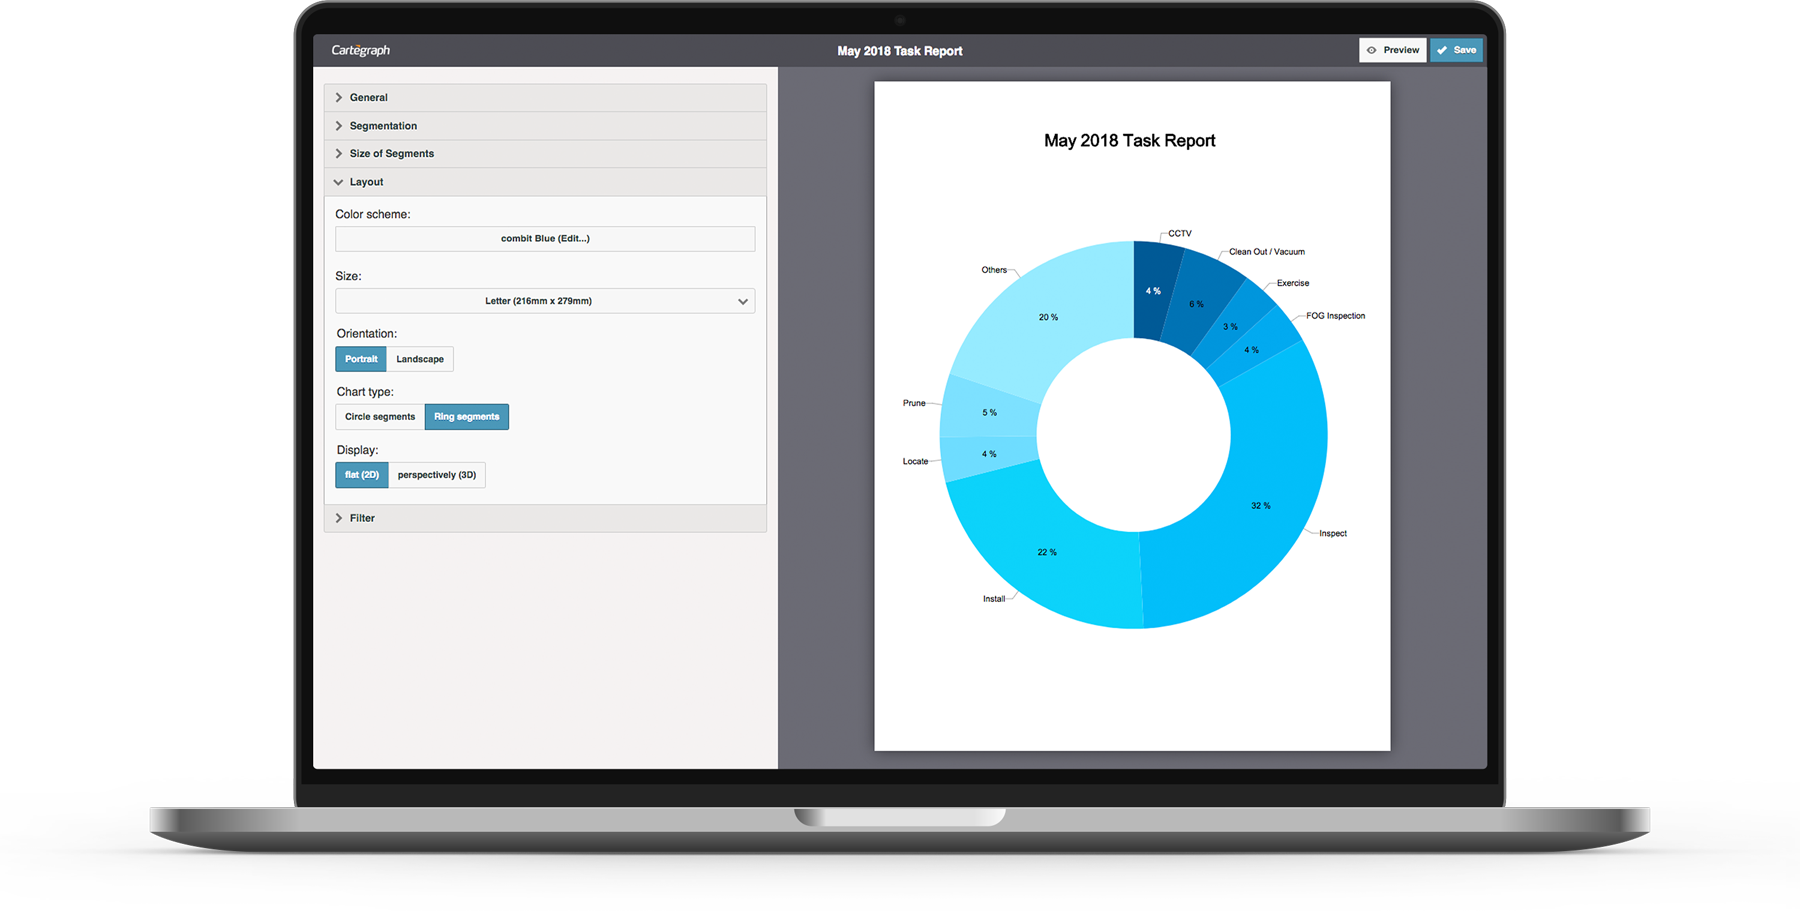
Cartegraph users primarily leverage the Ad-hoc Designer to create charts and tables for purpose-built reports. This web control is built on the ASP.NET MVC Framework and is completely browser-based, fitting seamlessly into Cartegraph’s easy-to-use web application.
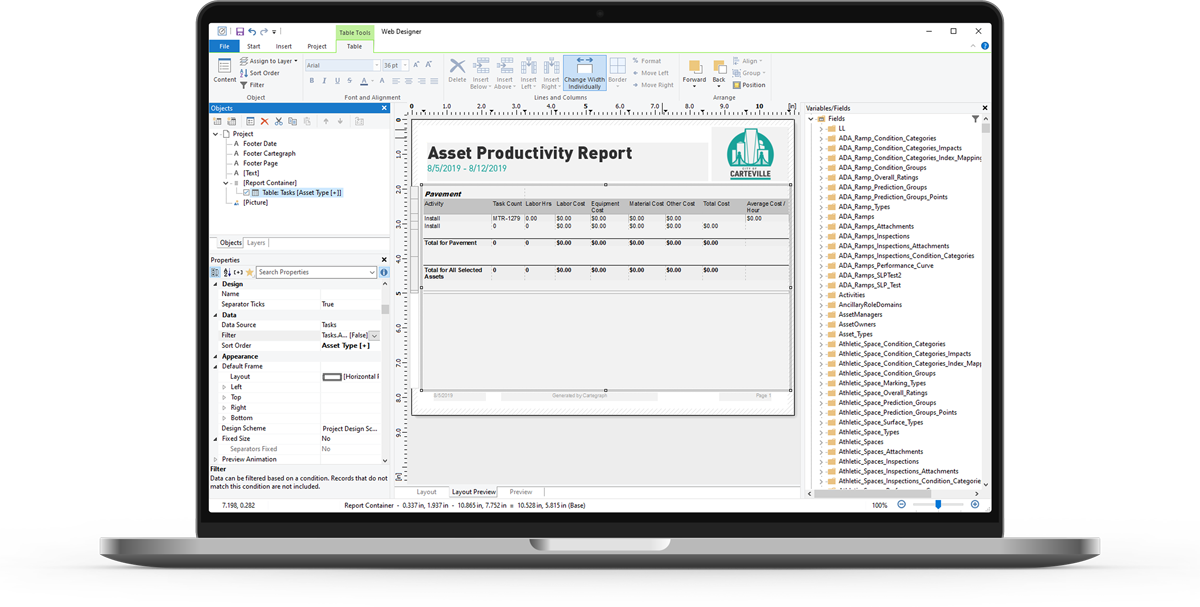
The Ad-hoc Designer provides a wide range of charts, and is easy and intuitive to use. If advanced report modifications are required — such as legends, label placement, and orientation adjustment — Cartegraph customers switch to the Web Designer.
The final charts and reports are then displayed in Cartegraph’s web application via the HTML5 Viewer. The viewer also enables interactive reporting through drilldown and report parameters. This makes it possible for Cartegraph’s clients to customize their reports even further by showing or hiding tables, sorting data according to their needs, applying filters via report parameters, and drilling down to a greater level of detail.
Product Manager, Cartegraph
Jon Kremer

″combit’s List & Label reporting tool makes it easy for the Cartegraph team to continue to provide our customers a high-performance product with superior flexibility and functionality. Over the years, our strong partnership with combit has enabled us to implement many customer-focused enhancement requests.″
How List & Label helps to succeed
Results
- Less time spent on creating reports: Saving precious resources and increasing productivity.
- Work from anywhere on any device: Giving total flexibility to Cartegraph’s clients by supporting all common browsers.
- Make smarter decisions: Efficient budget spending analysis based on clear cut reports and charts.
- Predict and plan for the future: Visualizations encourage data-informed budgeting, improve capital planning and budget requests.
Test Fully Functional 30-Day Trial Version for Free


