
combit Report Server
The combit Report Server is a flexibly scalable web-based reporting platform which integrates seamlessly into your cloud environment or on-premises infrastructure. Reports can be created, opened, viewed, edited and shared with other users via the browser.
Ready to Use Out-of-the-Box
Install the Report Server on a Windows system and start using it immediately. Create reports conveniently with the Designer and distribute them automatically – for example as PDF documents via email.

Flexible Linking to Data Sources
Connect the Report Server . OData, REST, RSS, XML and JSON-based data sources also support automated download from the Internet.
Platform-Independent in the Browser
Create reports regardless of your platform in the browser on Windows, iOS, Android or Linux. The Report Server is optimized for all common browsers on desktop and mobile devices.
Cloud Reporting Without the Hassle
Use the Report Server for cloud-based reporting without in-house development. Integrate the tool directly into your cloud infrastructure via the REST API and add preconfigured data sources and reports.
Self-Service Reporting Solution
As a standalone solution, the combit Report Server makes it possible for you to create reports out-of-the-box without in-house development. As a result, users are able to create evaluations on their own and accelerate work processes.
Make use of a single platform for controlling, sales management and competitive analysis in order to detect existing trends in your business data, and for strategic and data-driven decisions.
Integration Into Your Application
The combit Report Server can be easily integrated into your own applications via the REST API, e.g. for retrieving reports directly – entirely independent of platform and language.
Additional functions are available in the .NET environment via the specialized ClientApi, e.g. for adding existing List & Label reports and data sources.
A look inside the Report Server
Dauer: 13 min.
Create Reports with the Report Server Designer
With combit Report Server, you can create your reports either directly in the browser or in a locally installed Windows application – depending on the use case.
Various Report Types
Use countless design options to create customized tables, lists, reports, dashboards, labels, letters, forms and invoices.
Tables and Crosstabs
With the table object in the Report Server, you can create simple reports such as customer or product lists with just a few clicks. For more complex reports with multiple dimensions, use the crosstab object.
Charts
The Report Server provides an extensive selection of chart options, enabling your users to bring their concepts to life. This ranges from traditional bar and pie charts to line and area charts, and even extends to advanced geovisualizations with shapefiles or Rscript visualizations.
Interactive Reports
Interactive features allow users to interact with reports and present complex issues clearly. Report Server provides a variety of interactive features such as drilldown, expandable regions, report parameters, sorting, and animations.
A Multitude of Design Elements
The Report Server Designer features a wide range of design options such as lines, rectangles, ellipses, texts, formatted texts, HTML, PDF and much more. The properties of the various elements such as position, alignment, layer, display requirements and colors can thus be flexibly defined down to the smallest detail.
Barcode Module
Nearly 60 license-free barcode formats are available in the barcode module. In addition to common barcodes such as EAN128, GS1 and Pharmacode, 2D codes are also included such as Aztec, Datamatrix and QR code. An overview of available barcode formats can be found here.
User-Defined Elements and Functions
Users can program their own objects and functions for the Report Server Designer and make them available as a module. In this way, designer functionality can be expanded virtually without limits.
Change History
The last 10 versions of any given report template are automatically saved to change history, making it easy for you to keep everything under control. They can be retrieved and reactivated as desired.
Report Caching
Previously generated reports can be cached and thus made available again in a flash. Server load is reduced as a result and IT resources are conserved when large numbers of users access a report. Caching duration can be configured individually.
Reuse Content in Different Reports
With the help of report elements, subreports and project includes, you can incorporate and reuse individual elements (images, PDF files, formatted texts, shapefiles), complete charts and lists, or even entire letterheads and footers in new projects. This saves a great deal of time when creating new report templates.
Powerful Formula Language
Where formulas are involved, fixed text, variables and fields can be used in functions and linked by means of operators. The formula wizard supports you during data entry with a variety of input tools.
Assigning Reports to a Language
Specify languages for report templates in order to print reports in various languages. With the help of many useful functions, content such as currencies and date are automatically adapted to the language used for printing.
Report Server Configuration
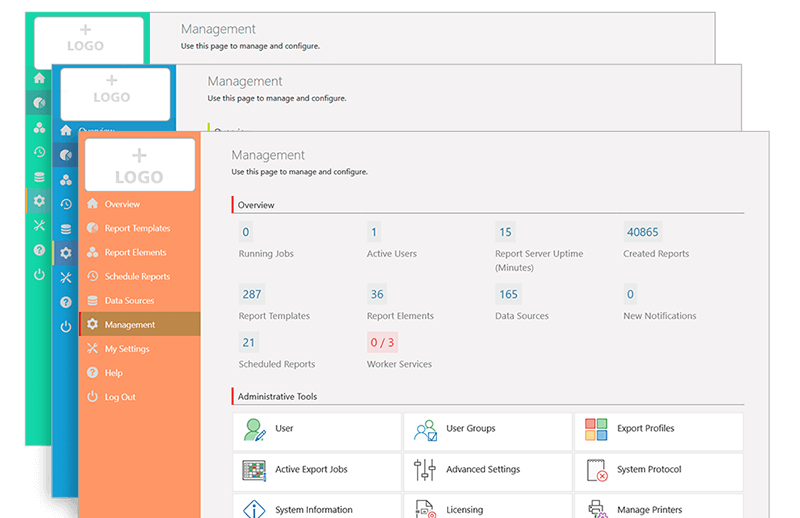
White Label Solution
Customize the Report Server to match your corporate design. Replace Report Server logos with your own and make use of accent colors, e.g. for the sidebar.
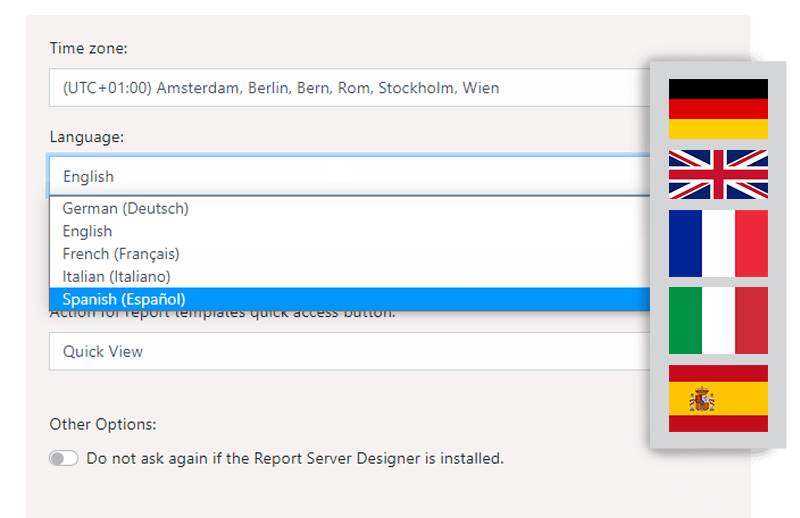
Multilingual Interface
German, English, French, Italian or Spanish can be selected in the language settings for the user interface.
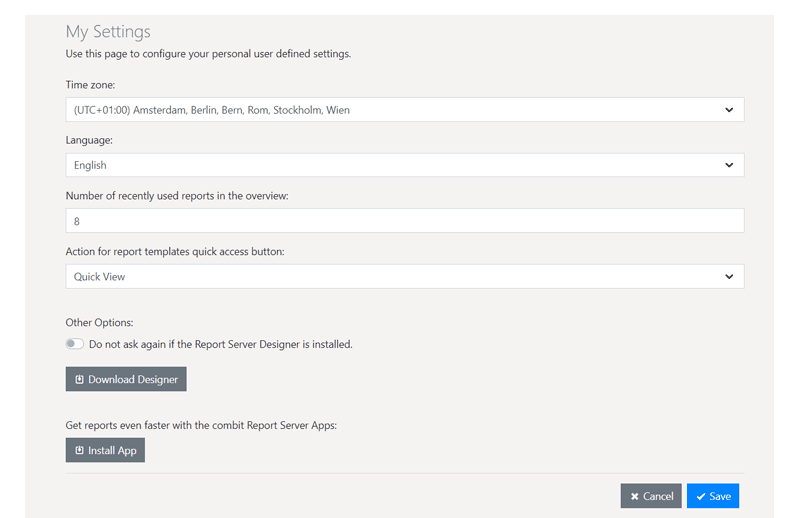
Personal Settings
In addition to selecting your language, personal settings can also be used to specify a time zone and set up the Report Server Designer and Report Server apps, as well as quick access to report templates.
Management
Everything at a glance: The central management view provides information regarding logged-in users, on-going jobs, scheduled and actively generated reports and much more.
Easy data transfer: Export and import settings and report templates between multiple Report Server systems.
Seamless logging: Activity logging provides an overview of messages and events which have occurred within the system.
Load balancing with worker services: When generating numerous reports at the same time, processing load can be distributed to other systems in order to optimize performance of the Report Server in the event of heavy workloads.


Security
Access rights: Specify the rights of each user individually – from editing report templates or data sources right on up to administration rights.
Import from active directory: Import users from the active directory.
Secure user login via Windows authentication (single sign-on): Users are logged in from the browser with their Windows/domain accounts.
Increased security for passwords: Define password strength rules based on password policies.
Export and Distribution
Unlimited export options: Export your reports in various formats such as PDF, Word, Excel, CSV, HTML, XML, JSON, SVG and many more.
Configured export profiles: Create individually configured export profiles with numerous format-specific options.
Automated generation and distribution: Plan reports flexibly based on various options such as timing, frequency, export format and distribution via email or file upload via FTP, SFTP, Amazon S3, Microsoft One-Drive, Google Drive, Dropbox or even conventionally within the file system.


Data Sources
Numerous data sources: Choose from a wide range of data sources (ODBC, OLEDB, REST, SQL Server, Oracle etc.), which you can configure individually without any programming knowledge.
User data sources: Create your own data providers in order to connect the Report Server to virtually any data source.
Combine data sources: Add multiple data sources to your report templates.
Improved performance for complex queries: Stored procedures and table value functions can be added very easily in the Report Server.
Wizard for individual queries: Individual queries for selected data sources can be created conveniently with the wizard. Any desired conditions can be specified, combined and grouped.
Programming via the REST API
Integration into your application: Access Report Server functions via the REST interface, for example in order to retrieve reports.
Getting started is easy: Thanks to code samples for running the REST API in .NET.
Less coding: Automatically generate OpenAPI specifications (Swagger) in order to describe and visualize REST interfaces in a uniform fashion.
Freely expandable functionality: Develop your own .NET modules in order to make use of individual data sources or your own designer objects and functions.
Built-in help: Documentation of the REST API is included in the user interface (ReDoc).

Licensing
You can distribute the Report Server together with your List & Label Enterprise application to your customers free of charge. If you want to distribute the Report Server without List & Label application, each customer needs a separate List & Label Enterprise license.
What our customers say
Next Step
Test the Report Server in the online demo or with your own data in the fully functional and free trial.
Data Sources
- Apache Cassandra
- CouchDB
- CSV
- Firebird
- Google Analytics
- Google BigQuery
- Google Sheets
- GraphQL
- IBM DB2
- JSON
- MariaDB
- Microsoft Access
- Microsoft Azure SQL
- Microsoft Excel
- Microsoft SQL Server
- MongoDB
- MySQL
- OData
- ODBC
- OLE DB
- OpenEdge
- Oracle
- PostgreSQL
- Redis
- REST
- RSS
- Salesforce
- SQLite
- XML
Additional possibilities:
- Multiple data sources for each report
- Single queries via SQL
- Stored Procedures and Table-Valued-Functions for SQL (MS SQL, PostgreSQL, Oracle and MySQL/MariaDB)
- Query assistant (MS SQL, PostgreSQL, Oracle and MySQL/MariaDB)
- Definition of relations
You can also easily create your own data providers with List & Label and add them to the Report Server.
Barcodes
- 2 of 5: DataLogic | Interleaved | Industrial | Matrix
- 3 of 9 alias Alpha 39 alias Code39: mit CRC | ohne CRC
- Aztec
- Codabar | Codablock F | Code 11 | Code 128 | Code 93 | Code 93x 0
- Datamatrix
- Deutsche Post: Identcode | Leitcode | Premiumadress
- EAN-13 P2 (ISSN) Magazines
- EAN-13 P5 (Bookland- ISBN) Books
- EPC (GiroCode) QR-Code
- German Parcel
- GS1 128 | EAN 128
- GS1 DataBar: Einfach | Expanded | Limited | Stacked | Stacked Omni | Truncated
- GTIN 13 | EAN 13 | UCC-13 | JAN-13
- GTIN 8 | EAN 8 | UCC-8 | JAN-8
- Intelligent Mail ® (IMB)
- ISBN
- Japanese Postcode
- KIX ®, Dutch Postcode
- Maxicode
- MSI | MSI Plain | MSI+10+10-MSI+10+CD | MSI+11+10
- NVE | SSCC
- Pharmacode
- PDF417 | MicroPDF417
- PZN | PZN8 (pharmaceutical registration number)
- QR-Code (minimum version configurable)
- Royal Mail | UK Postcode
- UPC-A/E
- US-FIM
- US-Postnet
Export Formats
- Bitmap
- CSV
- EMF vector graphics
- HTML
- JSON
- JPEG
- List & Label preview
- Multi-page TIFF (compression adjustable)
- MHTML
- Microsoft Excel (XLS and XLSX)
- Microsoft PowerPoint (PPTX)
- Microsoft Word (DOCX)
- Microsoft XPS
- PDF (also PDF/A)
- PNG
- Rich Text Format (RTF)
- SVG (scalable vector graphics)
- TIFF (compression adjustable)
- XML
Server-sided Printing
Reports can also be output directly to one or more printers set up on the
server. Once selected, they are then available in the export profiles. Different
export profiles can be configured for the different printer settings.
Report Distribution
- Copying files to the network
- Dropbox upload
- Email delivery (SMTP)
- FTP/FTPS upload
- Amazon S3 Upload
- Google Drive Upload
- Microsoft OneDrive Upload
- Microsoft Sharepoint Online
- SFTP-Upload
- Webhook call
- WebDav


