Reporting Tool Online Demo
Discover the Examples
Report Containers
Structure your reports
- Keep an overview
- Ideal for dashboards
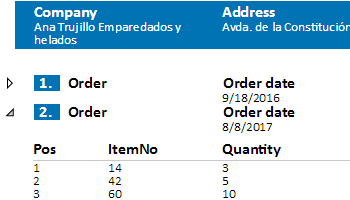
Subreports
Focus on the essentials
- Expandable regions
- Relations
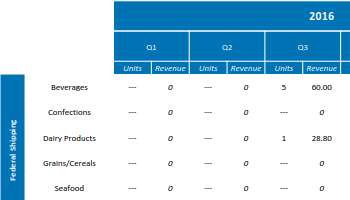
Crosstabs
Complex interrelationships
- Multiple result cells
- Cross-references
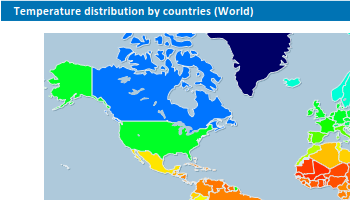
Shapefiles
Maps and more
- Geovisualization
- Many shapefiles included, expandable
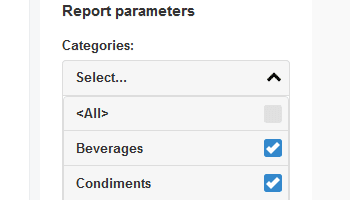
Report Parameters
Filter data interactively
- Narrow down values
- Define time periods
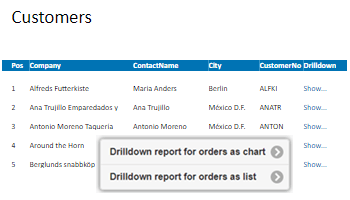
Drilldown
From overview to detail
- Charts
- Lists
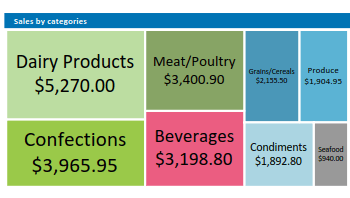
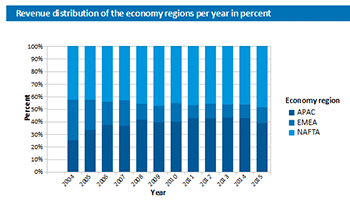
Charts
Comprehensive possibilities
- Line, bar, funnel, area,
ring, bubbles, radar, treemap…
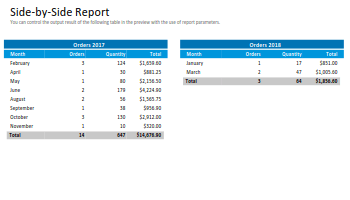
Side-by-Side Report
Multiple report containers
- Multiple report containers side by side
- Independent in the execution
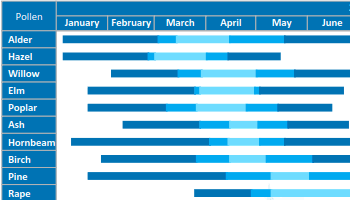
Gantt
Sequence of activities
- Machine maintenance plans
- Personnel planning
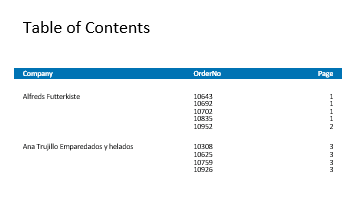
Table of Contents and Index
Creating reports automatically
- Clickable table of contents
- Clickable index
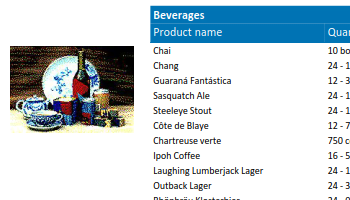
Nested Tables
Accurate layout
- Including subtables
- Present 1:n:m relationships
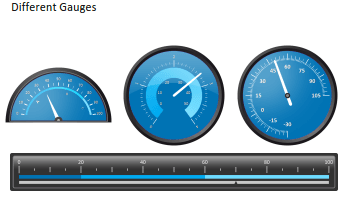
Gauges
Classify values
- Ideal, minimum and maximum
- Comprehensive customizable graphics
Test Fully Functional 30-Day Trial Version for Free


